NCEA Level 1 Mathematics 91946 free practice questions with answers
Read the opening questions and their worked answers from paper 1 of our 20-paper NCEA Level 1 Mathematics 91946 set, then download the 5-page PDF. These are original practice questions, not official past papers. Page updated 3 November 2026.

Topics: Comparing groups and trends over time (91946).
- Box plots: read the minimum, lower quartile, median, upper quartile and maximum; each section holds about a quarter of the data, so quartiles let you estimate percentages.
- Time series: describe the trend (the long-term direction), the repeating seasonal pattern and any unusual value, use numbers from the graph, and treat a prediction as an estimate that assumes the pattern continues.
Read the text of this sample
Question One (15 marks)
(a) The box plots show the time taken to run 1 km for a sample of students in Year 9 and a sample of students in Year 10.
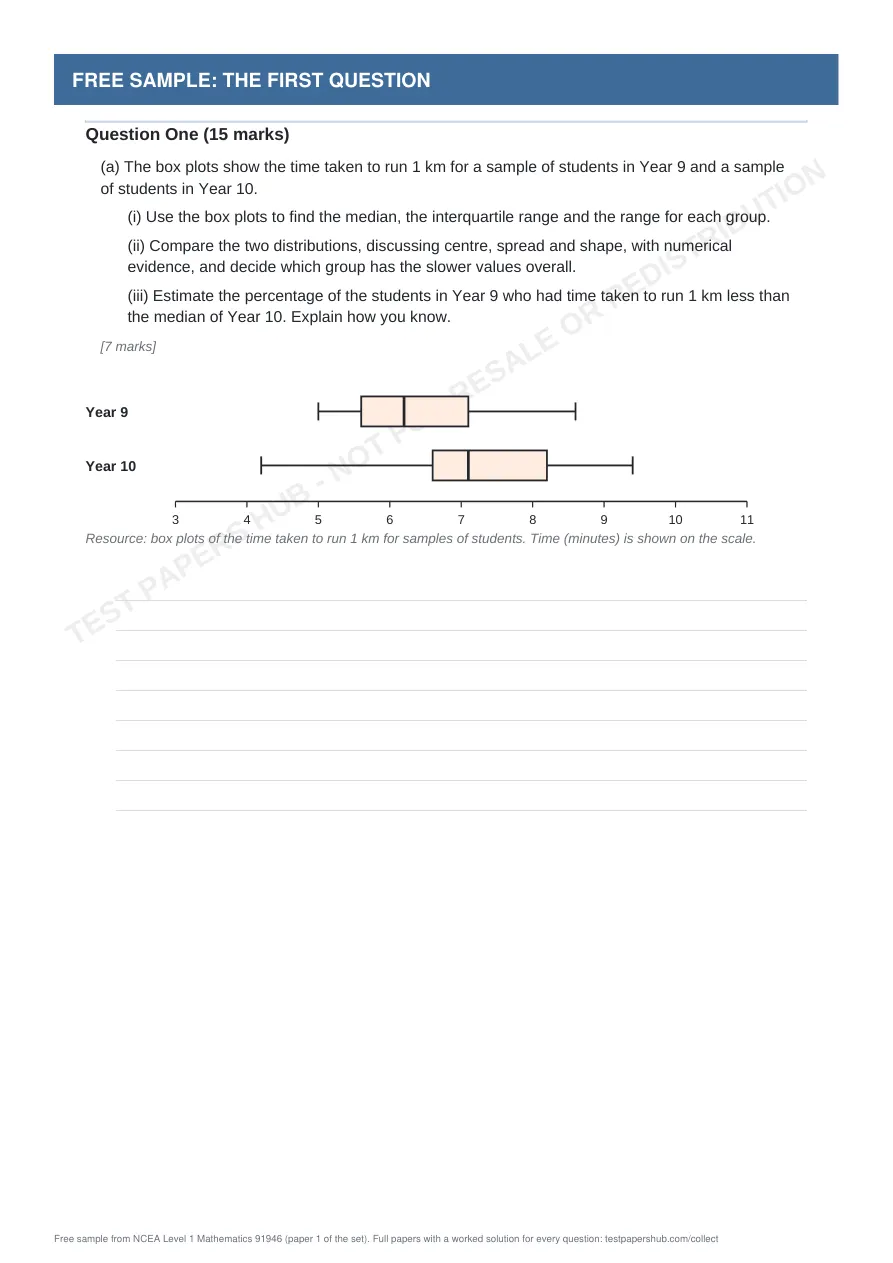
(i) Use the box plots to find the median, the interquartile range and the range for each group.
(ii) Compare the two distributions, discussing centre, spread and shape, with numerical evidence, and decide which group has the slower values overall.
(iii) Estimate the percentage of the students in Year 9 who had time taken to run 1 km less than the median of Year 10. Explain how you know.
[7 marks]
Year 9 Year 10 3 4 5 6 7 8 9 10 11 Resource: box plots of the time taken to run 1 km for samples of students. Time (minutes) is shown on the scale.
(b) The graph shows water used by a fictional Hamilton swimming pool for each quarter of the year.
(i) What was the value in Q3 of 2021? In 2021, by what percentage was the highest quarter greater than the lowest quarter?
(ii) Describe the trend over the four years, the repeating pattern within each year, and any unusual feature. Give evidence from the graph and a possible reason for the repeating pattern.
(iii) Predict the total for all four quarters of 2025. Explain how you made your prediction and how confident you are in it.
[8 marks]
0 10 20 30 40 50 60 70 80 Q1 Q2 Q3 Q4 Q1 Q2 Q3 Q4 Q1 Q2 Q3 Q4 Q1 Q2 Q3 Q4 2021 2022 2023 2024 Quarter (Q1 = Jan–Mar, Q2 = Apr–Jun, Q3 = Jul–Sep, Q4 = Oct–Dec) Thousand litres Resource: water used by a fictional Hamilton swimming pool, by quarter, 2021 to 2024 (fictional data).
Question 1 (15 marks) [Comparing groups and trends over time]
(a) The box plots show the time taken to run 1 km for a sample of students in Year 9 and a sample of students in Year 10. (i) Use the box plots to find the median, the interquartile range and the range for each group. (ii) Compare the two distributions, discussing centre, spread and shape, with numerical evidence, and decide which group has the slower values overall. (iii) Estimate the percentage of the students in Year 9 who had time taken to run 1 km less than the median of Year 10. Explain how you know. Year 9 Year 10 3 4 5 6 7 8 9 10 11 Resource: box plots of the time taken to run 1 km for samples of students. Time (minutes) is shown on the scale.
(a) Answer: (i) Year 9: median 6.2, IQR 1.5, range 3.6; Year 10: median 7.1, IQR 1.6, range 5.2;
(ii) Year 10 has the higher median; (iii) about 75%
• Evidence level: Merit (reading the five-number summary from the box plots, then comparing centre, spread and shape).
• (i) Year 9: median 6.2, IQR = 7.1 − 5.6 = 1.5, range = 8.6 − 5 = 3.6. Year 10: median 7.1, IQR = 8.2 − 6.6 = 1.6, range = 9.4 − 4.2 = 5.2.
• Achievement: (ii) Compares the medians: Year 10 (7.1 against 6.2).
• Merit: Compares centre and spread with numbers: medians 6.2 and 7.1, IQR 1.5 and 1.6.
• Excellence: Full comparison: Year 10 has the higher median, so it is slower overall; the IQRs are 1.5 and 1.6, so the middle half of Year 10 is more spread out; the shape of Year 9 is skewed to the right and of Year 10 is skewed to the right; the boxes overlap, so the groups are not completely separate.
• (iii) The median of Year 10 (7.1) equals the upper quartile of Year 9 (7.1), and a quartile marks off a quarter of the data, so about 75% of Year 9 had time taken to run 1 km less than it.
(b) The graph shows water used by a fictional Hamilton swimming pool for each quarter of the year. (i) What was the value in Q3 of 2021? In 2021, by what percentage was the highest quarter greater than the lowest quarter? (ii) Describe the trend over the four years, the repeating pattern within each year, and any unusual feature. Give evidence from the graph and a possible reason for the repeating pattern. (iii) Predict the total for all four quarters of 2025. Explain how you made your prediction and how confident you are in it. 0 10 20 30 40 50 60 70 80 Q1 Q2 Q3 Q4 Q1 Q2 Q3 Q4 Q1 Q2 Q3 Q4 Q1 Q2 Q3 Q4 2021 2022 2023 2024 Quarter (Q1 = Jan–Mar, Q2 = Apr–Jun, Q3 = Jul–Sep, Q4 = Oct–Dec) Thousand litres Resource: water used by a fictional Hamilton swimming pool, by quarter, 2021 to 2024 (fictional data).
(b) Answer: (i) 51 thousand litres; 25.5%; (ii) yearly totals 223, 226, 232, 233, peak in Q1; (iii) about 236 thousand litres
• Evidence level: Merit (reading values, calculating a percentage, and describing both the trend and the repeating pattern).
• (i) The value in Q3 of 2021 is 51. In 2021 the highest quarter (Q1) was 64 and the lowest was 51, so (64 − 51) ÷ 51 × 100 = 25.5%.
• Achievement: (ii) Describes the trend (yearly totals 223, 226, 232, 233) or the repeating pattern (peak in Q1).
• Merit: Describes both: the yearly totals 223, 226, 232, 233, going up; every year the peak is in Q1.
Your sample is downloading. Liked it? NCEA Level 1 Mathematics 91946 Paper 1 is the full paper: three questions made of several multi-part problems answered in writing (constructed response, no multiple choice), with a worked solution for every part that shows whether it is aimed at Achieved, Merit or Excellence, with a worked solution for every question.
Get Paper 1 for A$11.99See all 20 papers from A$11.99More free NCEA (New Zealand) samples
Questions about this sample
What is in the NCEA Level 1 Mathematics 91946 free sample?
The first 3 questions from paper 1 of the set, in the real exam layout, followed by the step-by-step worked answers. It is a 5-page PDF; this page shows the opening pages.
How many full NCEA Level 1 Mathematics 91946 papers are there?
20 original papers for New Zealand Level 1 students preparing for NCEA external standard 91946. Each is three questions made of several multi-part problems answered in writing (constructed response, no multiple choice), with a worked solution for every part that shows whether it is aimed at Achieved, Merit or Excellence, with a worked solution for every question. Papers start at A$11.99 and download instantly as a PDF.
Are these official past papers?
No. The sample is taken from our own original practice paper and is not an official past paper or affiliated with any exam authority.