NCEA Level 1 Science 91923 free practice questions with answers
Read the opening questions and their worked answers from paper 1 of our 20-paper NCEA Level 1 Science 91923 set, then download the 5-page PDF. These are original practice questions, not official past papers. Page updated 3 November 2026.

Topics: Claims and data (91923).
- Evaluating claims: calculate the percentage difference, compare it with the variation (ranges), check the sample size and the fair test, then decide whether the evidence supports the claim.
- Correlation and causation: variables that change together are correlated; to show cause, control other variables (fair test) and rule out a third factor.
Read the text of this sample
Question One (14 marks)
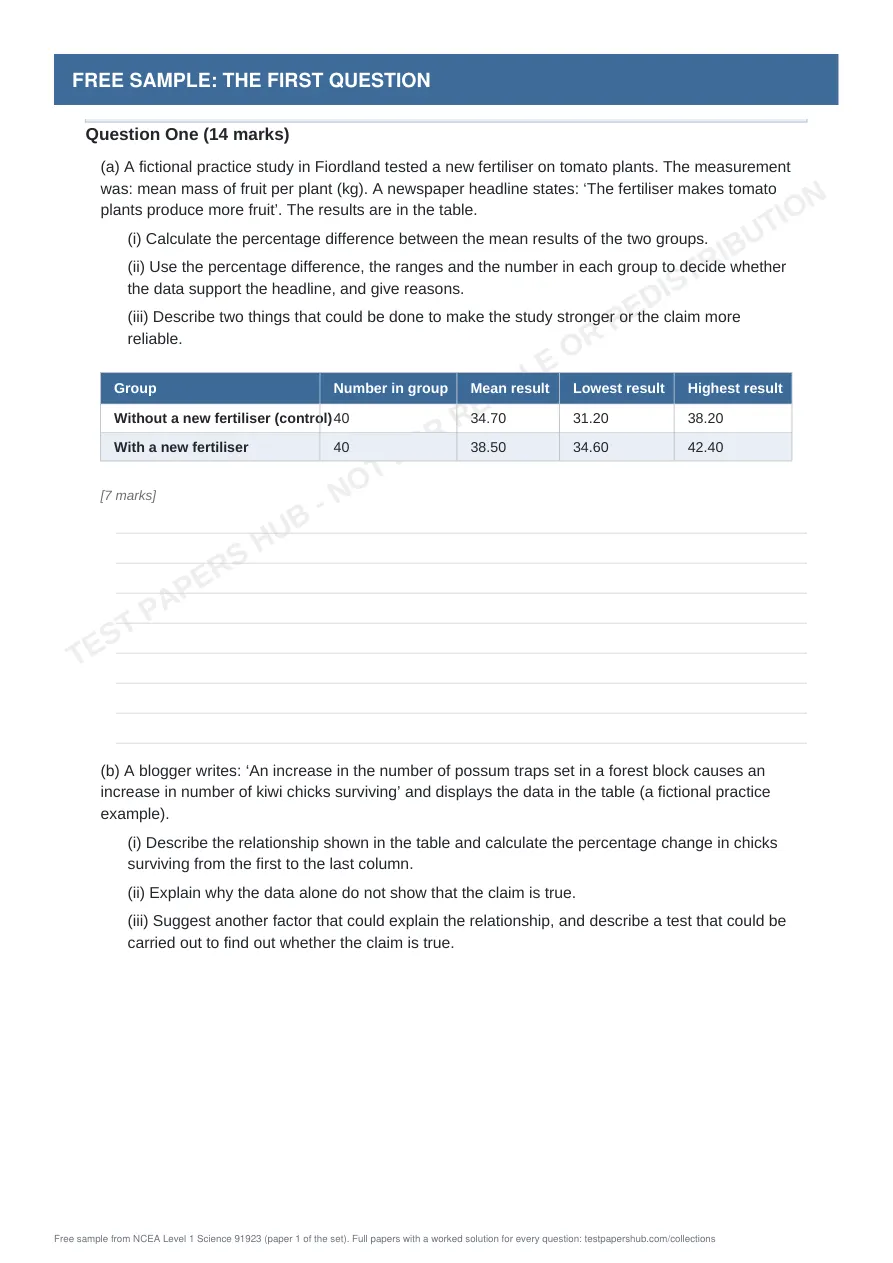
(a) A fictional practice study in Fiordland tested a new fertiliser on tomato plants. The measurement was: mean mass of fruit per plant (kg). A newspaper headline states: ‘The fertiliser makes tomato plants produce more fruit’. The results are in the table.
(i) Calculate the percentage difference between the mean results of the two groups.
(ii) Use the percentage difference, the ranges and the number in each group to decide whether the data support the headline, and give reasons.
(iii) Describe two things that could be done to make the study stronger or the claim more reliable. Group Number in group Mean result Lowest result Highest result Without a new fertiliser (control)40 34.70 31.20 38.20 With a new fertiliser 40 38.50 34.60 42.40
[7 marks]
(b) A blogger writes: ‘An increase in the number of possum traps set in a forest block causes an increase in number of kiwi chicks surviving’ and displays the data in the table (a fictional practice example).
(i) Describe the relationship shown in the table and calculate the percentage change in chicks surviving from the first to the last column.
(ii) Explain why the data alone do not show that the claim is true.
(iii) Suggest another factor that could explain the relationship, and describe a test that could be carried out to find out whether the claim is true.
[7 marks]
Question 1 (14 marks) [Claims and data]
(a) A fictional practice study in Fiordland tested a new fertiliser on tomato plants. The measurement was:
mean mass of fruit per plant (kg). A newspaper headline states: ‘The fertiliser makes tomato plants produce more fruit’. The results are in the table. (i) Calculate the percentage difference between the mean results of the two groups. (ii) Use the percentage difference, the ranges and the number in each group to decide whether the data support the headline, and give reasons. (iii) Describe two things that could be done to make the study stronger or the claim more reliable.
(a) Answer: (i) 11.0%; (ii) the data do not support the claim strongly enough (ranges overlap, n = 40); (iii) larger sample and repeat
• Evidence level: Merit (percentage difference = (treatment − control) ÷ control × 100; compare with the overlap of the ranges).
• (i) (38.50 − 34.70) ÷ 34.70 × 100 = 11.0%.
• (ii) The ranges overlap (31.20–38.20 and 34.60–42.40) and the difference is 11.0%, so the data do not support the claim strongly enough. With only 40 in each group, the sample is reasonably large, which makes the result more reliable.
• Achievement: (iii) Gives one improvement (for example a larger sample).
• Merit: Gives two improvements (for example a larger sample and repeating the trial).
• Excellence: Full answer: use more subjects so that chance is less likely to explain the result; repeat the trial (replication) to see whether the same result is obtained; keep all other variables the same for both groups (fair test) and assign subjects to groups at random; use a blind or double-blind design so expectations do not influence the results; have the study reviewed by other scientists before reporting it.
(b) A blogger writes: ‘An increase in the number of possum traps set in a forest block causes an increase in number of kiwi chicks surviving’ and displays the data in the table (a fictional practice example). (i) Describe the relationship shown in the table and calculate the percentage change in chicks surviving from the first to the last column. (ii) Explain why the data alone do not show that the claim is true. (iii) Suggest another factor that could explain the relationship, and describe a test that could be carried out to find out whether the claim is true.
(b) Answer: (i) positive relationship; change 525%; (ii) correlation is not cause; (iii) the amount of funding for the whole conservation programme
• Evidence level: Merit (describe the trend, calculate the percentage change, then separate correlation from cause).
• (i) As traps set increases, chicks surviving generally increases (a positive correlation). Change = (25 − 4) ÷ 4 × 100 = 525%.
• Achievement: (ii) States that correlation does not prove cause.
• Merit: Links to another variable: both could be affected by a third factor.
• Excellence: Full explanation: the table shows that the two variables change together (a correlation), but this does not show that one causes the other; both could be caused by a third (confounding) variable, the cause and effect could be the other way round, or the pattern could be chance with a small sample of only 5 points.
Your sample is downloading. Liked it? NCEA Level 1 Science 91923 Paper 1 is the full paper: three questions made of several multi-part problems answered in writing (constructed response, no multiple choice), with a worked solution for every part that shows whether it is aimed at Achieved, Merit or Excellence, with a worked solution for every question.
Get Paper 1 for A$11.99See all 20 papers from A$11.99More free NCEA (New Zealand) samples
Questions about this sample
What is in the NCEA Level 1 Science 91923 free sample?
The first 3 questions from paper 1 of the set, in the real exam layout, followed by the step-by-step worked answers. It is a 5-page PDF; this page shows the opening pages.
How many full NCEA Level 1 Science 91923 papers are there?
20 original papers for New Zealand Level 1 students preparing for NCEA external standard 91923. Each is three questions made of several multi-part problems answered in writing (constructed response, no multiple choice), with a worked solution for every part that shows whether it is aimed at Achieved, Merit or Excellence, with a worked solution for every question. Papers start at A$11.99 and download instantly as a PDF.
Are these official past papers?
No. The sample is taken from our own original practice paper and is not an official past paper or affiliated with any exam authority.