NCEA Level 3 Economics 91400 Structures free practice questions with answers
Read the opening questions and their worked answers from paper 1 of our 20-paper NCEA Level 3 Economics 91400 Structures set, then download the 8-page PDF. These are original practice questions, not official past papers. Page updated 3 November 2026.

Topics: Monopoly (91400).
- Supernormal profit is the rectangle (P − AC) × Q; the deadweight loss is the triangle between demand and marginal cost beyond Qm; a monopolist charges more than marginal cost.
- A monopoly produces where MR = MC, then reads the price from the demand curve above that output (not from MR).
- A monopolist maximises profit where MR = MC, but charges P > MC, so it produces less than the allocatively efficient output and causes a deadweight loss.
- After a demand increase both AR and MR shift right, so the MR = MC point moves to a higher output and price; recalculate revenue, cost and profit.
Read the text of this sample
Question One (21 marks)
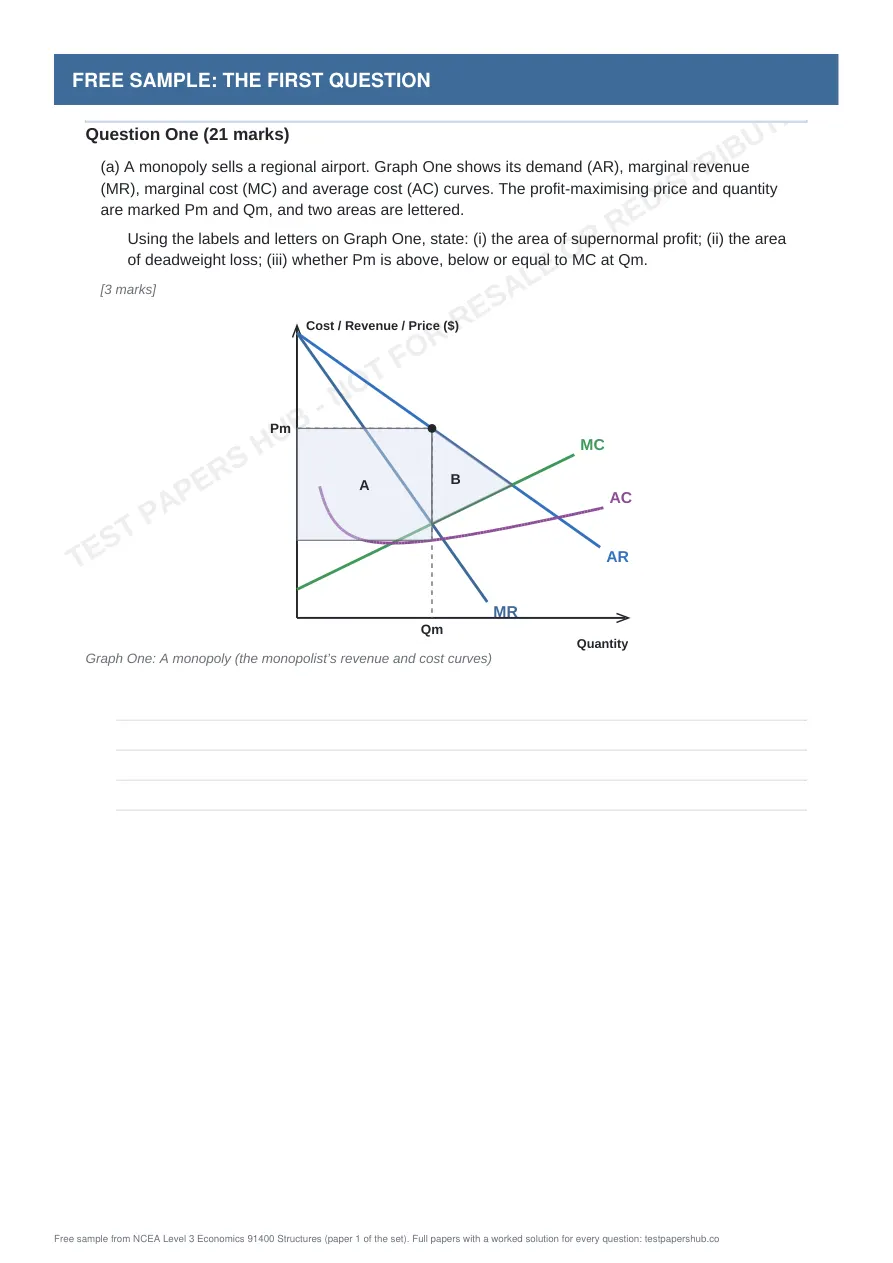
(a) A monopoly sells a regional airport. Graph One shows its demand (AR), marginal revenue (MR), marginal cost (MC) and average cost (AC) curves. The profit-maximising price and quantity are marked Pm and Qm, and two areas are lettered. Using the labels and letters on Graph One, state: (i) the area of supernormal profit; (ii) the area of deadweight loss; (iii) whether Pm is above, below or equal to MC at Qm.
[3 marks]
Cost / Revenue / Price ($) Quantity AR MR MC AC A B Qm Pm Graph One: A monopoly (the monopolist’s revenue and cost curves)
(b) The monopoly’s demand is P = 52 − 1Q and its total cost is TC = 19 + 22Q + 2Q², where Q is in thousand units and TC is in $ thousand. Use marginal analysis to find the profit-maximising output and price, then calculate total revenue, total cost and profit. State whether the profit is supernormal, normal or a loss.
[4 marks]
(c) Explain why the monopoly produces Qm and not a higher or lower quantity, using marginal analysis, and explain whether the monopoly is allocatively efficient. Use your answers to the calculation and Graph One.
[5 marks]
(d) The demand for a rail link between two cities rises, which raises the price a buyer will pay at every quantity by $12. Before the increase, demand was P = 40 − 1Q; the monopoly’s total cost is TC = 51 + 10Q + 2Q² (Q in thousand units, TC in $ thousand). Graph Two shows the new marginal revenue curve MR₁. Calculate the profit-maximising output and price, and the profit, before and after the increase in demand.
[4 marks]
Cost / Revenue / Price ($) Quantity AR MR MC MR₁ AC Qe Pe Graph Two: A monopoly before and after an increase in demand
(e) Using marginal analysis and Graph Two, explain the profit-maximising output after the increase in demand. Then explain the type of profit made before and after the increase, and how the monopoly will respond to the change in profit.
[5 marks]
Question 1 (21 marks) [Monopoly]
(a) A monopoly sells a regional airport. Graph One shows its demand (AR), marginal revenue (MR), marginal cost (MC) and average cost (AC) curves. The profit-maximising price and quantity are marked Pm and Qm, and two areas are lettered. Using the labels and letters on Graph One, state: (i) the area of supernormal profit; (ii) the area of deadweight loss; (iii) whether Pm is above, below or equal to MC at Qm. Cost / Revenue / Price ($) Quantity AR MR MC AC A B Qm Pm Graph One: A monopoly (the monopolist’s revenue and cost curves)
(a) Answer: (i) A; (ii) B; (iii) Pm is above MC (P > MC)
• Evidence level: Achieved (reads the profit and deadweight-loss areas and compares price with marginal cost).
• Supernormal profit is the rectangle between price Pm and average cost AC at Qm, out to Qm: area A.
• Deadweight loss is the triangle between AR (demand) and MC for the units between Qm and the output where AR = MC: area B.
• At Qm the price Pm is above MC (MC is read from the MC curve directly below the point on AR), so P > MC.
(b) The monopoly’s demand is P = 52 − 1Q and its total cost is TC = 19 + 22Q + 2Q², where Q is in thousand units and TC is in $ thousand. Use marginal analysis to find the profit-maximising output and price, then calculate total revenue, total cost and profit. State whether the profit is supernormal, normal or a loss.
(b) Answer: Qm = 5 thousand; Pm = $47; TR = $235 thousand; TC = $179 thousand; profit = $56 thousand (supernormal profit)
• Evidence level: Merit (derives MR and MC, sets MR = MC and finds revenue, cost and profit).
• MR = 52 − 2Q (twice as steep as demand) and MC = 22 + 4Q.
• Set MR = MC: 52 − 2Q = 22 + 4Q, so 6Q = 30 and Qm = 5 thousand.
• Price from demand: Pm = 52 − 1 × 5 = $47.
• Total revenue = 47 × 5 = $235 thousand. Total cost = 19 + 22 × 5 + 2 × 5² = $179 thousand.
• Profit = 235 − 179 = $56 thousand: this is supernormal profit.
(c) Explain why the monopoly produces Qm and not a higher or lower quantity, using marginal analysis, and explain whether the monopoly is allocatively efficient. Use your answers to the calculation and Graph One.
(c) Answer: MR = MC at Qm; P > MC so allocatively inefficient; deadweight loss $2.5 thousand
• Evidence level: Excellence (uses marginal analysis both sides of Qm and quantifies the inefficiency).
• Achievement: The monopoly produces where MR = MC because that maximises profit. It is allocatively inefficient because the price is above marginal cost.
• Merit: At Qm = 5 thousand, MR = MC = $42. Below Qm each extra unit adds more to revenue than to cost (MR > MC), so profit rises if output rises; above Qm each extra unit adds more to cost than to revenue (MR < MC), so profit falls. The price Pm = $47 is read from the demand curve, and it is above MC ($42).
Your sample is downloading. Liked it? NCEA Level 3 Economics 91400 Structures Paper 1 is the full paper: three written questions on market structures: monopoly, perfect competition, natural monopoly and marginal analysis, with worked solutions showing Achieved, Merit and Excellence answers, with a worked solution for every question.
Get Paper 1 for A$11.99See all 20 papers from A$11.99More free NCEA (New Zealand) samples
Questions about this sample
What is in the NCEA Level 3 Economics 91400 Structures free sample?
The first 3 questions from paper 1 of the set, in the real exam layout, followed by the step-by-step worked answers. It is a 8-page PDF; this page shows the opening pages.
How many full NCEA Level 3 Economics 91400 Structures papers are there?
20 original papers for New Zealand Level 3 students preparing for NCEA external standard 91400. Each is three written questions on market structures: monopoly, perfect competition, natural monopoly and marginal analysis, with worked solutions showing Achieved, Merit and Excellence answers, with a worked solution for every question. Papers start at A$11.99 and download instantly as a PDF.
Are these official past papers?
No. The sample is taken from our own original practice paper and is not an official past paper or affiliated with any exam authority.