NCEA Scholarship Statistics free practice questions with answers
Read the opening questions and their worked answers from paper 1 of our 20-paper NCEA Scholarship Statistics set, then download the 4-page PDF. These are original practice questions, not official past papers. Page updated 3 November 2026.

Topics: Comparing two fertiliser mixes (93201).
- Compare two groups on centre first (difference in means), then say whether the spreads are similar; a conclusion about the samples is not yet a conclusion about the process.
- A re-randomisation test asks how often shuffling alone gives a difference as big as the one seen; random allocation is what permits the word 'cause'.
- Match the interval to the test (does it include 0?), then name what population the sample really represents: sampling from one site limits who the result applies to.
Read the text of this sample
Question One (8 marks)
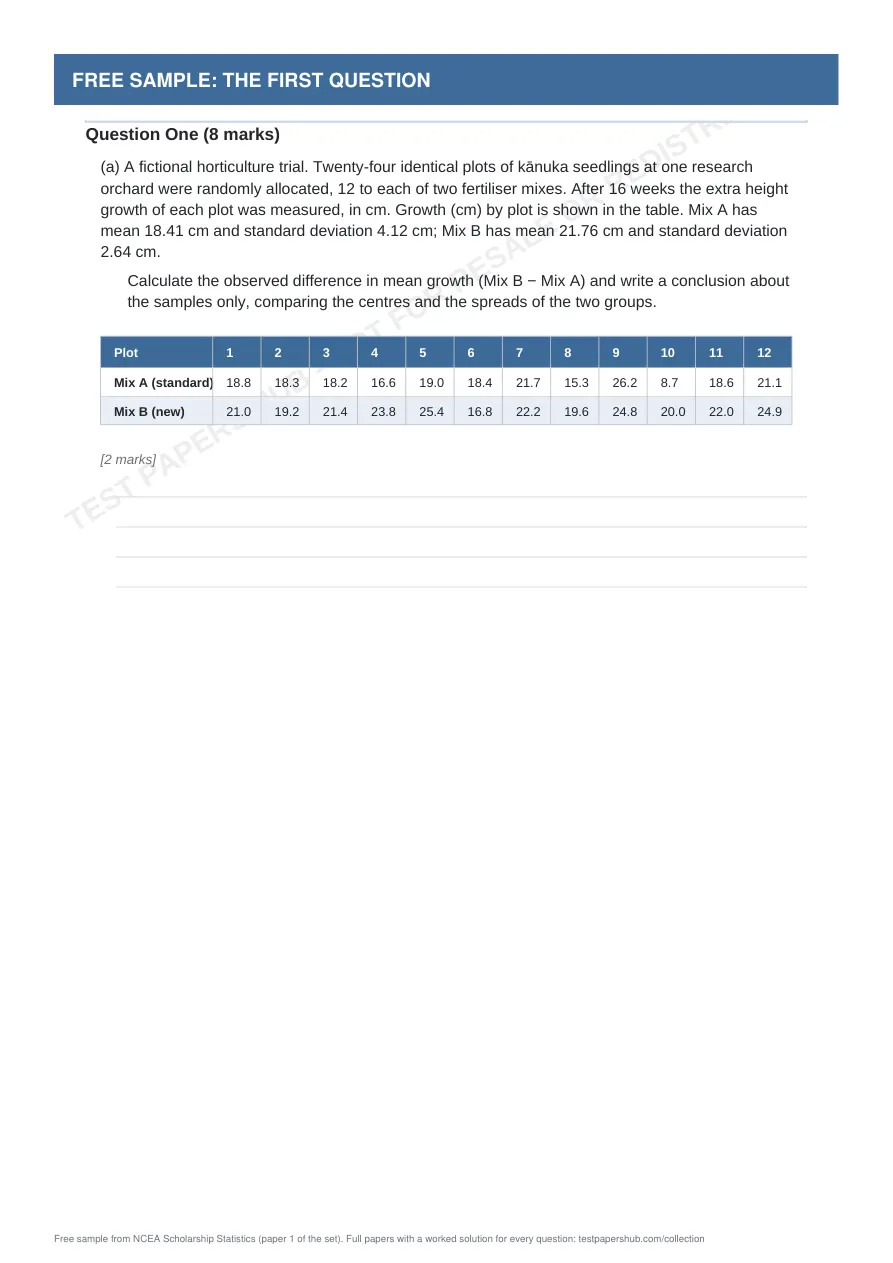
(a) A fictional horticulture trial. Twenty-four identical plots of kānuka seedlings at one research orchard were randomly allocated, 12 to each of two fertiliser mixes. After 16 weeks the extra height growth of each plot was measured, in cm. Growth (cm) by plot is shown in the table. Mix A has mean 18.41 cm and standard deviation 4.12 cm; Mix B has mean 21.76 cm and standard deviation 2.64 cm. Calculate the observed difference in mean growth (Mix B − Mix A) and write a conclusion about the samples only, comparing the centres and the spreads of the two groups. Plot 1 2 3 4 5 6 7 8 9 10 11 12 Mix A (standard) 18.8 18.3 18.2 16.6 19.0 18.4 21.7 15.3 26.2 8.7 18.6 21.1 Mix B (new) 21.0 19.2 21.4 23.8 25.4 16.8 22.2 19.6 24.8 20.0 22.0 24.9
[2 marks]
(b) The observed difference was re-randomised 10 000 times: the 24 growth values were shuffled at random into two groups of 12 and the difference in means (B − A) recorded. The table summarises the distribution. Exactly 120 of the 10 000 differences were greater than or equal to the observed difference of 3.35 cm. Explain what this re-randomisation test tells you, and state what you can conclude about the effect of the fertiliser on these plots. Difference (B − A), cm Number of the 10 000 below −3 238 −3 to below −2 792 −2 to below −1 1612 −1 to below 0 2287 0 to below 1 2292 1 to below 2 1711 2 to below 3 840 3 or more 228
[3 marks]
(c) A bootstrap analysis (10 000 resamples with replacement from each group) gave a 95% confidence interval for the true mean difference (B − A) of 0.76 cm to 6.06 cm. Explain how this interval agrees with your answer to part (b), and discuss two limitations in extending the finding to kānuka growing in New Zealand generally.
[3 marks]
Question 1 (8 marks) [Comparing two fertiliser mixes]
(a) A fictional horticulture trial. Twenty-four identical plots of kānuka seedlings at one research orchard were randomly allocated, 12 to each of two fertiliser mixes. After 16 weeks the extra height growth of each plot was measured, in cm. Growth (cm) by plot is shown in the table. Mix A has mean 18.41 cm and standard deviation 4.12 cm; Mix B has mean 21.76 cm and standard deviation 2.64 cm. Calculate the observed difference in mean growth (Mix B − Mix A) and write a conclusion about the samples only, comparing the centres and the spreads of the two groups.
(a) Answer: Observed difference = 3.35 cm
• Entry step: worth marks in the 1-4 range of the 8-point question score.
• Difference = 21.76 − 18.41 = 3.35 cm; the plots given Mix B grew more on average. [1 mark]
• The spreads differ: the standard deviations are 4.12 (Mix A) and 2.64 (Mix B), so Mix A is the more variable group, partly because of a few extreme plots. The difference is mainly in the centre. This describes these 24 plots only. [1 mark]
(b) The observed difference was re-randomised 10 000 times: the 24 growth values were shuffled at random into two groups of 12 and the difference in means (B − A) recorded. The table summarises the distribution. Exactly 120 of the 10 000 differences were greater than or equal to the observed difference of 3.35 cm. Explain what this re-randomisation test tells you, and state what you can conclude about the effect of the fertiliser on these plots.
(b) Answer: p-value = 0.0120; evidence that Mix B causes more growth in these plots
• Scholarship band (5-6): the part needs your own method and accurate reasoning.
• If the mix made no difference, every shuffle is as likely as the actual allocation. The proportion of shuffles at least as extreme as 3.35 is 120 ÷ 10 000 = 0.0120. [1 mark]
• A result this large would occur by chance alone in only about 1.2% of random allocations, which is unlikely, so there is evidence that the difference is real (not just allocation luck). [1 mark]
• The plots were randomly allocated, so other differences are balanced out and the mix can be said to cause the extra growth in these plots. (It is only moderate evidence: p is not tiny.) [1 mark]
(c) A bootstrap analysis (10 000 resamples with replacement from each group) gave a 95% confidence interval for the true mean difference (B − A) of 0.76 cm to 6.06 cm. Explain how this interval agrees with your answer to part (b), and discuss two limitations in extending the finding to kānuka growing in New Zealand generally.
(c) Answer: Interval 0.76 to 6.06 excludes 0; limits: one orchard, small samples
• Outstanding band (7-8): the part needs insight and a complete, well-supported argument.
• The interval from 0.76 to 6.06 does not contain 0, matching the small p-value of part (b): a mean difference of 0 is not a plausible value. The interval is wide for such a small sample, so the true size of the benefit is uncertain (it could be small). [1 mark]
Your sample is downloading. Liked it? NCEA Scholarship Statistics Paper 1 is the full paper: four questions of 8 points (32 in all) in three hours on statistical investigation, statistical literacy and probability, each with printed data and software-style output, with a worked solution for every part showing the score band, with a worked solution for every question.
Get Paper 1 for A$11.99See all 20 papers from A$11.99More free NCEA (New Zealand) samples
Questions about this sample
What is in the NCEA Scholarship Statistics free sample?
The first 3 questions from paper 1 of the set, in the real exam layout, followed by the step-by-step worked answers. It is a 4-page PDF; this page shows the opening pages.
How many full NCEA Scholarship Statistics papers are there?
20 original papers for New Zealand Year 13 students preparing for NZ Scholarship Statistics (standard 93201). Each is four questions of 8 points (32 in all) in three hours on statistical investigation, statistical literacy and probability, each with printed data and software-style output, with a worked solution for every part showing the score band, with a worked solution for every question. Papers start at A$11.99 and download instantly as a PDF.
Are these official past papers?
No. The sample is taken from our own original practice paper and is not an official past paper or affiliated with any exam authority.